Data Scientist VS Data Analyst

Hi everyone! Hope you will fine all. I always prefer to write post on
basic definition and difference between or among of those critical
and related word which is running on the globe in the form of
job/title/of AI base concept related using simple and basic approach.
 In the previous Article 
tried to make you understand about the differences between R
and Python in term of comparison if you did not read it first you
read it Python VS R Latest Trend in the Market. Now, in this Article
we are going to understand the difference between in the most
growing field of Artificial Intelligence, Data Scientist VS Data Analyst.

Data Science:

      As name suggest Data Science, where Science (methods) has been applied on data to purify it and get useful data on it. It is under big domain in which different scientific methods and tools apply. For instance mathematics, statistics and other related tools which deal to solve the data sets. These methods extract the knowledge from data. Not only these tools capable them to deal with the data extraction only also for big data handling. In the Data Science field Data Scientist is one of the sexiest job (field) these days, as Data Scientist, he gathered data sets from multi disciples and compiles it, then apply deep learning and machine on it to predict and analysis the data in sufficient form.
       The most growing job from data science field is Data Scientist and Data Analyst, let’s understand the differences and responsibilities between them and get to know how they are related and depend on each other.

Who is Data Scientist?

       A word data means fact and figure, a person who is working on data, understand the data according to the field of business and industries point of view by using different technique especially mathematical model and statistic is called a Data Scientist. These techniques boost the scientist to extract knowledge insight form the existing data in different forms similar to data mining (structure and unstructured form).
The roles of Data Scientist further divided into Four (04) parts (roles) according to their skills.
Data Business people
Data Developers
Data Researcher
Data Creatives

Who is Data Analyst?

      As name suggest Data Scientist, Data Analyst works! But as Data Analyst the person responsible to transforming, cleansing, and modeling the data for the purpose of getting useful information from the data. Also Data Analyst handle new data to find the latest trends on it which is helpful for the data scientists.
The roles of Data Analyst further divided into Four (04) parts (roles) according to their skills.
Database Administrators
Operations
Data Architects
Analytics Engineer

Comparison of Data Scientist and Data Analyst in term of skills


Data Scientist
Data Analyst
As a Data Scientist he/she should know the languages like R, Python, SAS, Matlab and also related languages need to learn.
As a Data Analyst he/she should know the languages like HTML, Javascript, R, and related languages.
In database should know SQL and Hive.
In database should know SQL and Hive in-depth to analysis.
Visualization of data and expounding business stories to others teams in the organization.
Specialization tool like Qlikview, Tableau, MSBi.
Here he/she required Machine learning concept.
There is no necessary of it.
Recently the salary graph is higher than Data Analyst.
Here salary graph is lower than Data Science.


Job Trend of Data Science VS Data Analyst:

       The salary (average) for a Data Scientist is around $117,000 whereas for Data Scientist it would be $62,000. However, despite considering many differences between the job titles, one cannot be successful without the other as we considered it before.
The Graph demonstrate the job and salary growth of them!


Hope you will get right information about DataSciencist VS DataAnayst! 
For more useful and informative Article and post keep visiting my Blog 
and  share it those who want to learn this concept, remember I plan to 
start video tutorial soon about the programming language PYTHON
 and on R using machine learning and keep learning concept,
ABSOLUTELY FREE 
KEEP IT TOUCH!!!

Data Scientist VS Data Analyst

Hi everyone! Hope you will fine all. I always prefer to write post on
basic definition and difference between or among of those critical
and related word which is running on the globe in the form of
job/title/of AI base concept related using simple and basic approach.
 In the previous Article 
tried to make you understand about the differences between R
and Python in term of comparison if you did not read it first you
read it Python VS R Latest Trend in the Market. Now, in this Article
we are going to understand the difference between in the most
growing field of Artificial Intelligence, Data Scientist VS Data Analyst.

Data Science:

      As name suggest Data Science, where Science (methods) has been applied on data to purify it and get useful data on it. It is under big domain in which different scientific methods and tools apply. For instance mathematics, statistics and other related tools which deal to solve the data sets. These methods extract the knowledge from data. Not only these tools capable them to deal with the data extraction only also for big data handling. In the Data Science field Data Scientist is one of the sexiest job (field) these days, as Data Scientist, he gathered data sets from multi disciples and compiles it, then apply deep learning and machine on it to predict and analysis the data in sufficient form.
       The most growing job from data science field is Data Scientist and Data Analyst, let’s understand the differences and responsibilities between them and get to know how they are related and depend on each other.

Who is Data Scientist?

       A word data means fact and figure, a person who is working on data, understand the data according to the field of business and industries point of view by using different technique especially mathematical model and statistic is called a Data Scientist. These techniques boost the scientist to extract knowledge insight form the existing data in different forms similar to data mining (structure and unstructured form).
The roles of Data Scientist further divided into Four (04) parts (roles) according to their skills.
Data Business people
Data Developers
Data Researcher
Data Creatives

Who is Data Analyst?

      As name suggest Data Scientist, Data Analyst works! But as Data Analyst the person responsible to transforming, cleansing, and modeling the data for the purpose of getting useful information from the data. Also Data Analyst handle new data to find the latest trends on it which is helpful for the data scientists.
The roles of Data Analyst further divided into Four (04) parts (roles) according to their skills.
Database Administrators
Operations
Data Architects
Analytics Engineer

Comparison of Data Scientist and Data Analyst in term of skills


Data Scientist
Data Analyst
As a Data Scientist he/she should know the languages like R, Python, SAS, Matlab and also related languages need to learn.
As a Data Analyst he/she should know the languages like HTML, Javascript, R, and related languages.
In database should know SQL and Hive.
In database should know SQL and Hive in-depth to analysis.
Visualization of data and expounding business stories to others teams in the organization.
Specialization tool like Qlikview, Tableau, MSBi.
Here he/she required Machine learning concept.
There is no necessary of it.
Recently the salary graph is higher than Data Analyst.
Here salary graph is lower than Data Science.


Job Trend of Data Science VS Data Analyst:

       The salary (average) for a Data Scientist is around $117,000 whereas for Data Scientist it would be $62,000. However, despite considering many differences between the job titles, one cannot be successful without the other as we considered it before.
The Graph demonstrate the job and salary growth of them!


Hope you will get right information about DataSciencist VS DataAnayst! 
For more useful and informative Article and post keep visiting my Blog 
and  share it those who want to learn this concept, remember I plan to 
start video tutorial soon about the programming language PYTHON
 and on R using machine learning and keep learning concept,
ABSOLUTELY FREE 
KEEP IT TOUCH!!!

Python VS R Latest Trend in the Market


Basic Understanding:
        Day by Day we are going ahead where we are facing big data, it is critical to handle and visualize it in appropriate manner. Different programming languages handles different kind of problem such as (C++, C#) for desktop application, mobile application, web base application, but in the domain of programming language R and Python are old languages R designed on August 1993; and Python in 1991 but its impressive libraries emphases us to use it for big data (analysis, and predication) where we need to predict and visualization using Artificial Intelligence, machine learning, deep learning also for Data Science (statistical purpose).
In the usage war, both programming language waging each other, action, rule and predication action these two has own importance according to the modern era both language ratio in usage, in 2017 R highlighted in the world by its usage and it unique libraries.


Introduction:
For statistical calculation and graphic R programming language has been used. The R GNU based, which is similar to S language, where it environment designed at Bell Laboratories (formerly AT&T, now Lucent Technologies) by John Chambers and colleagues. Different designing and it implementation of S can be considered as R. Both not be, same there are many difference between S and R in other work. Also, R bestrew big range of different statistical related modeling, classical statistical test, time s series analysis, classification, clustering function etc…and related graphical techniques, which are nightly extensible, whereas S provide the research statistical methodology, and R provides the open source route to participation in the activity.
For R, it is very easy to formulate the mathematical symbols and drawing the plot using well designed publication. These graphic design by default running possibilities present in window, Unix and related platforms available on it.
R as Programming LanguageIt is the Open source counterpart of SAS, traditionally been used in academics and research. It is open source nature basically, latest techniques get released quickly. There is a lot of documentation available over the internet and it is a very cost-effective option.

Python as Programming Language: It is an open source scripting language as like others,  It is one of the growing language. These days, it stunning libraries (scipy, numpy and matplotlib) and functions for almost any statistical operation / model building you may want to do. Also using of pandas showing the file handing in very smart way for data handing and others related mathematical models work.
R is traditionally open source programming language, which is not only used in data science field but also in different field of life.
           In term of differences and opponent there are a lot of differences between them to shows the grow of that language in the different field in this ear, such as data science, machine learning, data science and data analyst, but In the Article I am going to discuss TEN differences which effect to grow and popularity reason of R and Python in the globe.
Let's understand these differences:


History
    Python is an interpreted high-level programming language for general-purpose programming, which has been created by Guido van Rossum in 1991, The two version (2.0 and 3.0) of python create conflict between the user, and from these two others sub version is going to created time to time (2.7 or 3.2), right now the current latest version (as of Fall 2018) is Python 3.6.4. Whereas in R is a programming language as like other it is free environment for statistical computing and also support for graphic which has been designed by Ross Ihaka and Robert Gentleman in 1995, the latest version of R which is running in market is  3.5.1 which is available on the official website of R to download.
Community
   The main purpose of community to provide help as quick service. There are different community available to provide stunning performance to produce stage as community like on R website community,  Stackoverflow, Mailing list, user contributed code and documentation also different developer and programmer create own community to held it up. Whereas in R community Mailing list, user contributed code and documentation and Active stackoverflow members few data scientist and statisticians also provide the huge community as compare to python which grow more result then python popularity.
Purpose
    Python always force on productivity and code readability and usability because it is an Object oriented language. It is English related keyword supported language (logical operator AND, OR AND NOT). Also not only folks use it to make better programming also use it for gaming by using PyGame library. Whereas in R, it is focus on Data to fix, predict, analysis and deep concept of statistic and graphic model for graph related plotting.
Usability
    As we discuss about the syntax of Python for coding is easy because several keyword and writing tool related to English easy word, that’s why running and debugging is easy. Also, Indentation of code effect on it meaning, we must follow the pattern of python in term writing function (in the predefine way). Where as in R statistic related model can be written in few lines. Also, function can be written using several way as compare to python. R is generally suitable for any type of data analysis. The numerous number of packages and readily usable tests make starting any analysis quite easy as computer to python.
Flexibility
          In term of flexibility of python, it is more flexibility, we do new any time on it which is never did on before. Many user use it as scripting language also for web development. Python use to analysis project is part of a bigger project that involves many complexities easily. Where as in R, for data science in deep many developer prefer to use R then Python due to its powerful libraries also helpful to analysis complex data using huge list of R packages and statistical model.
Ease of learning
         In the field of computer programming, many developer prefer to build their logic first, for this many computer scientist to learn first Python, that’s why in different educational centers python has been taught as level first. For ease in the python learning, readability and usability make it easier for basic and easy to learn as compare to R. But also R is not hard for experience programmer.
Job Scenario
        According to the latest trends and report, R and Python are the competitive to each other, Last TWO Year the Popularity of Python is grow up then R, but we cannot ignore the popularity of R as well. Most of the companies follow the usage of R and python both for big data handling and data analysis. Accordingly the jobs setup change time to time in term of salary and also work on.
The jobs, ad in USA in 2017, through the website have a look!
Search by "Data Scientist" finds 3,558 jobs
Search by "Data Scientist" Python finds 2,407 jobs (68% of all)
Search by "Data Scientist" R finds 2,179 (61% of all).
Search by "Data Scientist" Python R finds 1,906 jobs (54% of all) and
Search for "Data Scientist" -Python -R finds 892 jobs (25% of all)
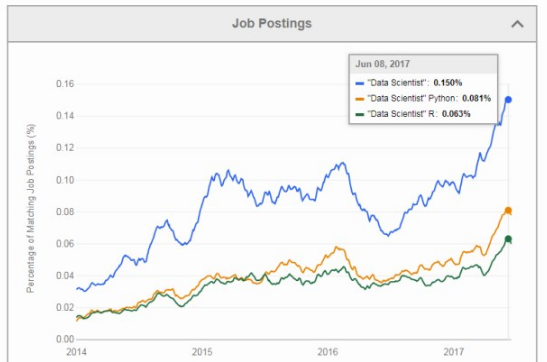
Also, the job and salaries graphs demonstrate this senses is easy way: The first one is showing the popularity of Python over R, second for Python as data science also third one shows for the same in ratio in June of 2017.


Data Handling
           For data handling I do not see any big differences between them which shows the realist effect on any programming language. Both handle the data by using libraries, Python use Numpy and Pandas to cover and handle the data in easy and sufficient way, whereas in R we do not need to install libraries for basic data handling but for big data and other advance work we need to install it like data.table and dplyr and others.
IDE support
        IDE means integrated development environment, for support of programming language coding and environment to run we need IDE according the related programming language like C/C++ Dev, C# Visual Studio. As like these For Python there are different IDE to code few of them which are most famous these days, Pycham, IPython Notebook, Spyder and Rodeo, where as in R the famous one is only RStudio.
Libraries
         Library is the collection of classes which provide the short way to code and get to required output using few line of code. In Python there are different libraries in this Article we will discuss main and famous of them, Pandas which is used to manipulate the date, Scipy and Numpy are used for scientific work and calculation. For graph we used matplotlib, and using statsmodels we explore the data, create the statistical modem and also perform different statistical test and unit test. Whereas in R different packages play a vital rule to make R more attractive in term of usage, dplyr, plyr and data.table are used to manipulate the date as like python, stringr is used to manipulate the string. Zoo not for (zoo) J but for working in regular and irregular time series. Ggvis, lattice and ggplot2 are used to visualize the date and caret for working on machine learning.

These all are the few differences which I observed
in the field and working by Research!
I am hopeful it will be informative for all of you!!!

Python VS R Latest Trend in the Market


Basic Understanding:
        Day by Day we are going ahead where we are facing big data, it is critical to handle and visualize it in appropriate manner. Different programming languages handles different kind of problem such as (C++, C#) for desktop application, mobile application, web base application, but in the domain of programming language R and Python are old languages R designed on August 1993; and Python in 1991 but its impressive libraries emphases us to use it for big data (analysis, and predication) where we need to predict and visualization using Artificial Intelligence, machine learning, deep learning also for Data Science (statistical purpose).
In the usage war, both programming language waging each other, action, rule and predication action these two has own importance according to the modern era both language ratio in usage, in 2017 R highlighted in the world by its usage and it unique libraries.


Introduction:
For statistical calculation and graphic R programming language has been used. The R GNU based, which is similar to S language, where it environment designed at Bell Laboratories (formerly AT&T, now Lucent Technologies) by John Chambers and colleagues. Different designing and it implementation of S can be considered as R. Both not be, same there are many difference between S and R in other work. Also, R bestrew big range of different statistical related modeling, classical statistical test, time s series analysis, classification, clustering function etc…and related graphical techniques, which are nightly extensible, whereas S provide the research statistical methodology, and R provides the open source route to participation in the activity.
For R, it is very easy to formulate the mathematical symbols and drawing the plot using well designed publication. These graphic design by default running possibilities present in window, Unix and related platforms available on it.
R as Programming LanguageIt is the Open source counterpart of SAS, traditionally been used in academics and research. It is open source nature basically, latest techniques get released quickly. There is a lot of documentation available over the internet and it is a very cost-effective option.

Python as Programming Language: It is an open source scripting language as like others,  It is one of the growing language. These days, it stunning libraries (scipy, numpy and matplotlib) and functions for almost any statistical operation / model building you may want to do. Also using of pandas showing the file handing in very smart way for data handing and others related mathematical models work.
R is traditionally open source programming language, which is not only used in data science field but also in different field of life.
           In term of differences and opponent there are a lot of differences between them to shows the grow of that language in the different field in this ear, such as data science, machine learning, data science and data analyst, but In the Article I am going to discuss TEN differences which effect to grow and popularity reason of R and Python in the globe.
Let's understand these differences:


History
    Python is an interpreted high-level programming language for general-purpose programming, which has been created by Guido van Rossum in 1991, The two version (2.0 and 3.0) of python create conflict between the user, and from these two others sub version is going to created time to time (2.7 or 3.2), right now the current latest version (as of Fall 2018) is Python 3.6.4. Whereas in R is a programming language as like other it is free environment for statistical computing and also support for graphic which has been designed by Ross Ihaka and Robert Gentleman in 1995, the latest version of R which is running in market is  3.5.1 which is available on the official website of R to download.
Community
   The main purpose of community to provide help as quick service. There are different community available to provide stunning performance to produce stage as community like on R website community,  Stackoverflow, Mailing list, user contributed code and documentation also different developer and programmer create own community to held it up. Whereas in R community Mailing list, user contributed code and documentation and Active stackoverflow members few data scientist and statisticians also provide the huge community as compare to python which grow more result then python popularity.
Purpose
    Python always force on productivity and code readability and usability because it is an Object oriented language. It is English related keyword supported language (logical operator AND, OR AND NOT). Also not only folks use it to make better programming also use it for gaming by using PyGame library. Whereas in R, it is focus on Data to fix, predict, analysis and deep concept of statistic and graphic model for graph related plotting.
Usability
    As we discuss about the syntax of Python for coding is easy because several keyword and writing tool related to English easy word, that’s why running and debugging is easy. Also, Indentation of code effect on it meaning, we must follow the pattern of python in term writing function (in the predefine way). Where as in R statistic related model can be written in few lines. Also, function can be written using several way as compare to python. R is generally suitable for any type of data analysis. The numerous number of packages and readily usable tests make starting any analysis quite easy as computer to python.
Flexibility
          In term of flexibility of python, it is more flexibility, we do new any time on it which is never did on before. Many user use it as scripting language also for web development. Python use to analysis project is part of a bigger project that involves many complexities easily. Where as in R, for data science in deep many developer prefer to use R then Python due to its powerful libraries also helpful to analysis complex data using huge list of R packages and statistical model.
Ease of learning
         In the field of computer programming, many developer prefer to build their logic first, for this many computer scientist to learn first Python, that’s why in different educational centers python has been taught as level first. For ease in the python learning, readability and usability make it easier for basic and easy to learn as compare to R. But also R is not hard for experience programmer.
Job Scenario
        According to the latest trends and report, R and Python are the competitive to each other, Last TWO Year the Popularity of Python is grow up then R, but we cannot ignore the popularity of R as well. Most of the companies follow the usage of R and python both for big data handling and data analysis. Accordingly the jobs setup change time to time in term of salary and also work on.
The jobs, ad in USA in 2017, through the website have a look!
Search by "Data Scientist" finds 3,558 jobs
Search by "Data Scientist" Python finds 2,407 jobs (68% of all)
Search by "Data Scientist" R finds 2,179 (61% of all).
Search by "Data Scientist" Python R finds 1,906 jobs (54% of all) and
Search for "Data Scientist" -Python -R finds 892 jobs (25% of all)
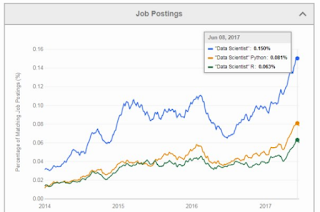
Also, the job and salaries graphs demonstrate this senses is easy way: The first one is showing the popularity of Python over R, second for Python as data science also third one shows for the same in ratio in June of 2017.


Data Handling
           For data handling I do not see any big differences between them which shows the realist effect on any programming language. Both handle the data by using libraries, Python use Numpy and Pandas to cover and handle the data in easy and sufficient way, whereas in R we do not need to install libraries for basic data handling but for big data and other advance work we need to install it like data.table and dplyr and others.
IDE support
        IDE means integrated development environment, for support of programming language coding and environment to run we need IDE according the related programming language like C/C++ Dev, C# Visual Studio. As like these For Python there are different IDE to code few of them which are most famous these days, Pycham, IPython Notebook, Spyder and Rodeo, where as in R the famous one is only RStudio.
Libraries
         Library is the collection of classes which provide the short way to code and get to required output using few line of code. In Python there are different libraries in this Article we will discuss main and famous of them, Pandas which is used to manipulate the date, Scipy and Numpy are used for scientific work and calculation. For graph we used matplotlib, and using statsmodels we explore the data, create the statistical modem and also perform different statistical test and unit test. Whereas in R different packages play a vital rule to make R more attractive in term of usage, dplyr, plyr and data.table are used to manipulate the date as like python, stringr is used to manipulate the string. Zoo not for (zoo) J but for working in regular and irregular time series. Ggvis, lattice and ggplot2 are used to visualize the date and caret for working on machine learning.

These all are the few differences which I observed
in the field and working by Research!
I am hopeful it will be informative for all of you!!!

Diseases Identification (Cancer) using Deep Learning (Keras library)

Hi, As I mention in the previous Article Understand about Keras,
 now in this Article we will understand about the Keras library
 work how does it work and how does is it install on your
machine, in a Project name by
Cancer Classification using Deep learning (Keras).

Classification Concept:

         Classification work on identification by using deep learning concept. For example by picture we can identify the gender similarly by picture we can identify the person is happy, normal or sad!!! The concept of classification we want to use on cancer disease using DNA dataset. In this Article, I predict by using deep learning (Keras library) the patient has cancer or not through it DNA dataset or gene. For this DNA data set download form www.Kaggle.com, in the data set the feature expectation through the gene (gene_1 to gene_49) including the five classes namely (BRCA, KIRC, COAD, LUAD, PRAD). By using these gene order and classes this project’s Article predict about the cancer is active or not.

       For implementation Python is the better choice, either R can be an alternative choice. I used also jupyter notebook for coding as well. But first we need to install KERAS for data handling which is deep learning library which I separately publish my Article on it, if you did not read you need to read it first Understandingabout Keras. Now the installation process should be like

$ pip install keras
Similarity for jupyter notebook installation,
$ jupyter notebook

       Now, move towards the working on Project using Keras, the coding of project as like this:

from keras.models import Sequential
from keras.layers import Dense
import numpy

        We will use numpy (library) to load data - there are septrients from data columns
To load the data we need to use NUMPY library, for separation we use delimiter, code will be like;

dataset = numpy.loadtxt("DNA_Dataset.csv", delimiter=’,’)

       As we know about the deep learning Data training, divide the existing data into two part TRAINING DATA AND TESTING DATA, the exist record consist on 391Rows * 44Columns. Separate 70% date for Training and 30% for Testing.

X = dataset[:274,0:8]
Y = dataset[:274,8]
X_test = dataset[274:,0:8]
Y_test = dataset[274:,8]

       Now, we will move towards Keras model for this we will use Dense and in this Dense the quantity of INPUT and HIDDEN nodes can be inserted.

model = Sequential()
model.add(Dense(12, input_dim=8, init='uniform', activation='relu'))
model.add(Dense(8, init='uniform', activation='relu'))
model.add(Dense(1, init='uniform', activation='sigmoid'))

       At that point we need to create different layer there are 4 Layers but it is depend on your problem for identification. In the first line it is an input layer which is consist on x nodes (depend on features which is define before gene 1 to 49also classes of identification namely (BRCA, KIRC, COAD, LUAD, PRAD)), then Hidden layer consist on 12 nodes (may be vary). Then we will create another Hidden layer on which 8 nodes exist. At last there is an output layer on which 1 node exit signed Sigmoid of its Activation Function because the problem is BINARY CLASSIFICATION.
Now, it time to compile the model.

model.compile(loss='binary_crossentropy',optimizer='adam',metrics=['accuracy'])

   We chose binary cross entropy for the loss function as it is based on the Binary classification - we will call fit to start training.

model.fit(X, Y, nb_epoch=150, batch_size=10,  verbose=2)

      We got fit data and labels - with this number of epoch or iteration kept 150 - via batch size we told that gradient descent will update weights after ten inputs - in the next step we examined the test data on next level.

scores = model.evaluate(X_test, Y_test)
print("\n%s:%.2f%%"% (model.metrics_names[1], scores[1]*100))

Result:

      We got between (70% to 75%) result accuracy, here in this project 74.35% got to predict the Cancer disease is active or not in the patient using DNA data set (gene) using 5 classes.

I am hopeful it will be very helpful for you understand the working of 
Keras in Project base work To download the exist data set which is
used in this project ClickToDownlaod.